

Market Update—Month Ending May 31, 2025
Markets found their footing in May, delivering strong gains across major indices amid a calmer policy backdrop and encouraging economic data. Investor sentiment improved as trade tensions eased and corporate earnings came in well above expectations, helping to offset lingering concerns about inflation and fiscal policy. Overall, the month reflected a more stable and optimistic tone compared to the volatility seen earlier in the year.
Quick Hits
1. Stock Surge
Markets rallied as trade tensions cooled and earnings beat expectations.
2. Bond Pressure
Rising interest rates weighed on bonds, but high-yield held up.
3. Economic Strength
Job growth, spending growth, and slowing inflation supported the outlook.
4. Risks Ahead
Policy shifts and global conflicts could stir future volatility.
Stocks Bounce Back in May
Markets had a strong rebound in May, helped by a cooling of trade tensions between the U.S. and China. This more relaxed tone gave investors confidence, leading to a solid rally in stocks:
The S&P 500 rose 6.29 percent.
The Dow Jones Industrial Average (DJIA) gained 4.16 percent.
The Nasdaq Composite, which includes many tech companies, jumped 9.65 percent.
Strong Company Earnings Helped Drive Gains
Aside from cooling trade tensions, another key reason for the market’s strong performance was better-than-expected earnings from companies. First-quarter earnings season just ended, and results were stronger than many predicted. According to Bloomberg Intelligence (as of May 30), companies in the S&P 500 saw average earnings growth of 13.5 percent—much higher than the 6.6 percent analysts expected. This shows that many businesses are off to a healthy start in 2025.
Over time, company performance (i.e., fundamentals) tends to drive stock prices, so this strong earnings growth is a good sign for investors.
Mixed Signals from Market Trends
Although company performance was strong, some technical indicators (tools investors use to spot trends) gave mixed signals:
The S&P 500 and Nasdaq ended the month above their 200-day moving averages. This is a long-term trend line that many investors watch to gauge market momentum.
The DJIA, however, stayed below its 200-day average for the third consecutive month. This could suggest that investors are still cautious about that part of the market.
Global Stocks Also Performed Well
International markets also had a good month:
Developed markets (such as Europe and Japan), tracked by the MSCI EAFE Index, rose 4.58 percent.
Emerging markets (such as Brazil and India), tracked by the MSCI Emerging Markets Index, gained 4.31 percent.
Technical indicators were also supportive for both groups of international stocks.
Bonds Struggle as Interest Rates Rise
While stocks fared well, bonds had a tougher time in May. Long-term interest rates went up, partly because investors are worried about the growing U.S. government deficit.
The 10-year U.S. Treasury yield rose from 4.25 percent to 4.41 percent.
The Bloomberg U.S. Aggregate Bond Index, which tracks a broad range of bonds, fell 0.72 percent.
High-yield bonds (which are riskier but offer higher returns), however, did better:
The Bloomberg U.S. Corporate High Yield Index rose 1.68 percent.
Credit spreads (the extra return investors demand for taking on more risk) narrowed from 3.94 percent to 3.32 percent, showing increased investor appetite for these bonds.
Trade Tensions Ease, for Now
A big reason for the market rally was a pause in the U.S.-China trade dispute. Midway through the month, both countries agreed to a 90-day break from new tariffs, which investors welcomed. This followed a similar pause in April for tariffs affecting other countries.
Although this was good news, trade policy remains uncertain. These pauses give more time for negotiations, but future changes could still shake up the markets. Investors should expect trade issues to remain a source of uncertainty in the months ahead.
Economic Data Shows Continued Strength
Economic reports released in May painted a mostly positive picture:
The U.S. added 177,000 jobs in April, beating expectations of 138,000.
Consumer spending and retail sales continued to grow.
Inflation slowed: Prices rose 2.3 percent over the past year, the lowest increase in more than four years.
Figure 1: Consumer Price Index for All Consumers, Year-over-Year Percentage Change
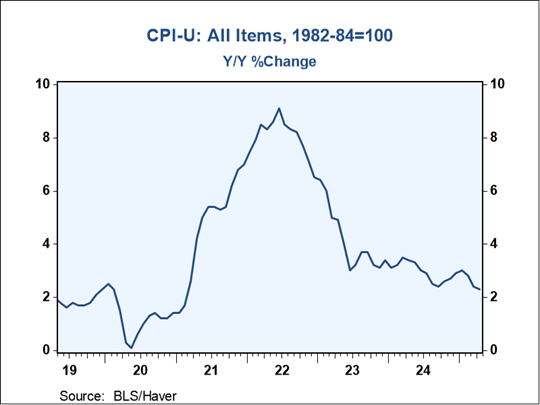
Source: BLS/Haver
This slowdown in inflation is a welcome sign for both the economy and the Federal Reserve, which has been trying to bring inflation under control.
Some Areas to Watch
Despite the good news, there are a few areas of concern:
· The economy shrank slightly in the first quarter, according to the GDP report.
· Consumer and business confidence are still lower than they were at the end of last year.
· The housing market remains sluggish, mainly due to high mortgage rates and home prices.
Because housing affects how much people spend on other things, it’s an important area to monitor going forward.
Risks Still on the Horizon
Even with May’s gains, there are still risks ahead:
Domestic policy uncertainty: Although trade tensions cooled in May, they could flare up again. Also, Congress is working on a budget bill that could bring major changes to tax policy.
Global risks: Ongoing conflicts in Ukraine and the Middle East continue to pose challenges.
Investors should stay alert because these issues could lead to more market ups and downs.
Looking Ahead: Cautious Optimism
Despite the risks, the overall outlook remains positive as we head into summer. The economy is still growing, the job market is strong, and there’s more clarity coming from Washington.
While the rocky start to the year reminded us that markets don’t like uncertainty, it’s possible that the worst of the turbulence is behind us—for now. Still, short-term bumps are always possible.
The best approach? Stick with a well-diversified investment plan that matches your goals and timeline. And, if you’re unsure, it’s a good time to check in with your financial advisor.
Disclosure: This material is intended for informational/educational purposes only and should not be construed as investment advice, a solicitation, or a recommendation to buy or sell any security or investment product. Please contact your financial professional for more information specific to your situation.
Certain sections of this commentary contain forward-looking statements based on our reasonable expectations, estimates, projections, and assumptions. Forward-looking statements are not guarantees of future performance and involve certain risks and uncertainties, which are difficult to predict. Past performance is not indicative of future results. Diversification does not assure a profit or protect against loss in declining markets. All indices are unmanaged and investors cannot invest directly into an index. The Dow Jones Industrial Average is a price-weighted average of 30 actively traded blue-chip stocks. The S&P 500 Index is a broad-based measurement of changes in stock market conditions based on the average performance of 500 widely held common stocks. The Nasdaq Composite Index measures the performance of all issues listed in the Nasdaq Stock Market, except for rights, warrants, units, and convertible debentures. The MSCI EAFE Index is a float-adjusted market capitalization index designed to measure developed market equity performance, excluding the U.S. and Canada. The MSCI Emerging Markets Index is a market capitalization-weighted index composed of companies representative of the market structure of 26 emerging market countries in Europe, Latin America, and the Pacific Basin. It excludes closed markets and those shares in otherwise free markets that are not purchasable by foreigners. The Bloomberg Aggregate Bond Index is an unmanaged market value-weighted index representing securities that are SEC-registered, taxable, and dollar-denominated. It covers the U.S. investment-grade fixed-rate bond market, with index components for a combination of the Bloomberg government and corporate securities, mortgage-backed pass-through securities, and asset-backed securities. The Bloomberg U.S. Corporate High Yield Index covers the USD-denominated, non-investment-grade, fixed-rate, taxable corporate bond market. Securities are classified as high-yield if the middle rating of Moody’s, Fitch, and S&P is Ba1/BB+/BB+ or below. One basis point (bp) is equal to 1/100th of 1 percent, or 0.01 percent.
Grant Capital is located at 7101 College Boulevard, Suite 880, Overland Park, KS 66210 and can be reached at (913) 361-8281. Securities and advisory services offered through Commonwealth Financial Network®, member FINRA/SIPC, a Registered Investment Adviser. Fixed insurance products and services are separate from and not offered through Commonwealth Financial Network®.
Authored by Chris Fasciano, chief market strategist, and Sam Millette, director, fixed income, at Commonwealth Financial Network®.
© 2025 Commonwealth Financial Network®